
manta is a fully managed suite of operational reporting dashboards designed to enhance your Redzone implementation.
manta helps manufacturing teams understand losses, performance drivers, and the impact of improvement activity over time.


.avif)

Manufacturing teams generate vast amounts of operational data, but turning that data into clear, prioritised action is often difficult. Insight is spread across multiple reports, views are inconsistent over time, and it can be hard to see which losses matter most or whether improvement efforts are really working.
As a result, performance conversations can become reactive and opinion-led. Teams spend significant time preparing reports for meetings, rather than focusing on understanding problems and driving change.
Designed to sit alongside Redzone, manta enhances your operational data and provides with a clear, consistent layer of reporting. For teams using Redzone to capture shop-floor data, manta adds structure and focus, helping teams prepare for daily and weekly performance meetings with trusted, ready-to-use views.
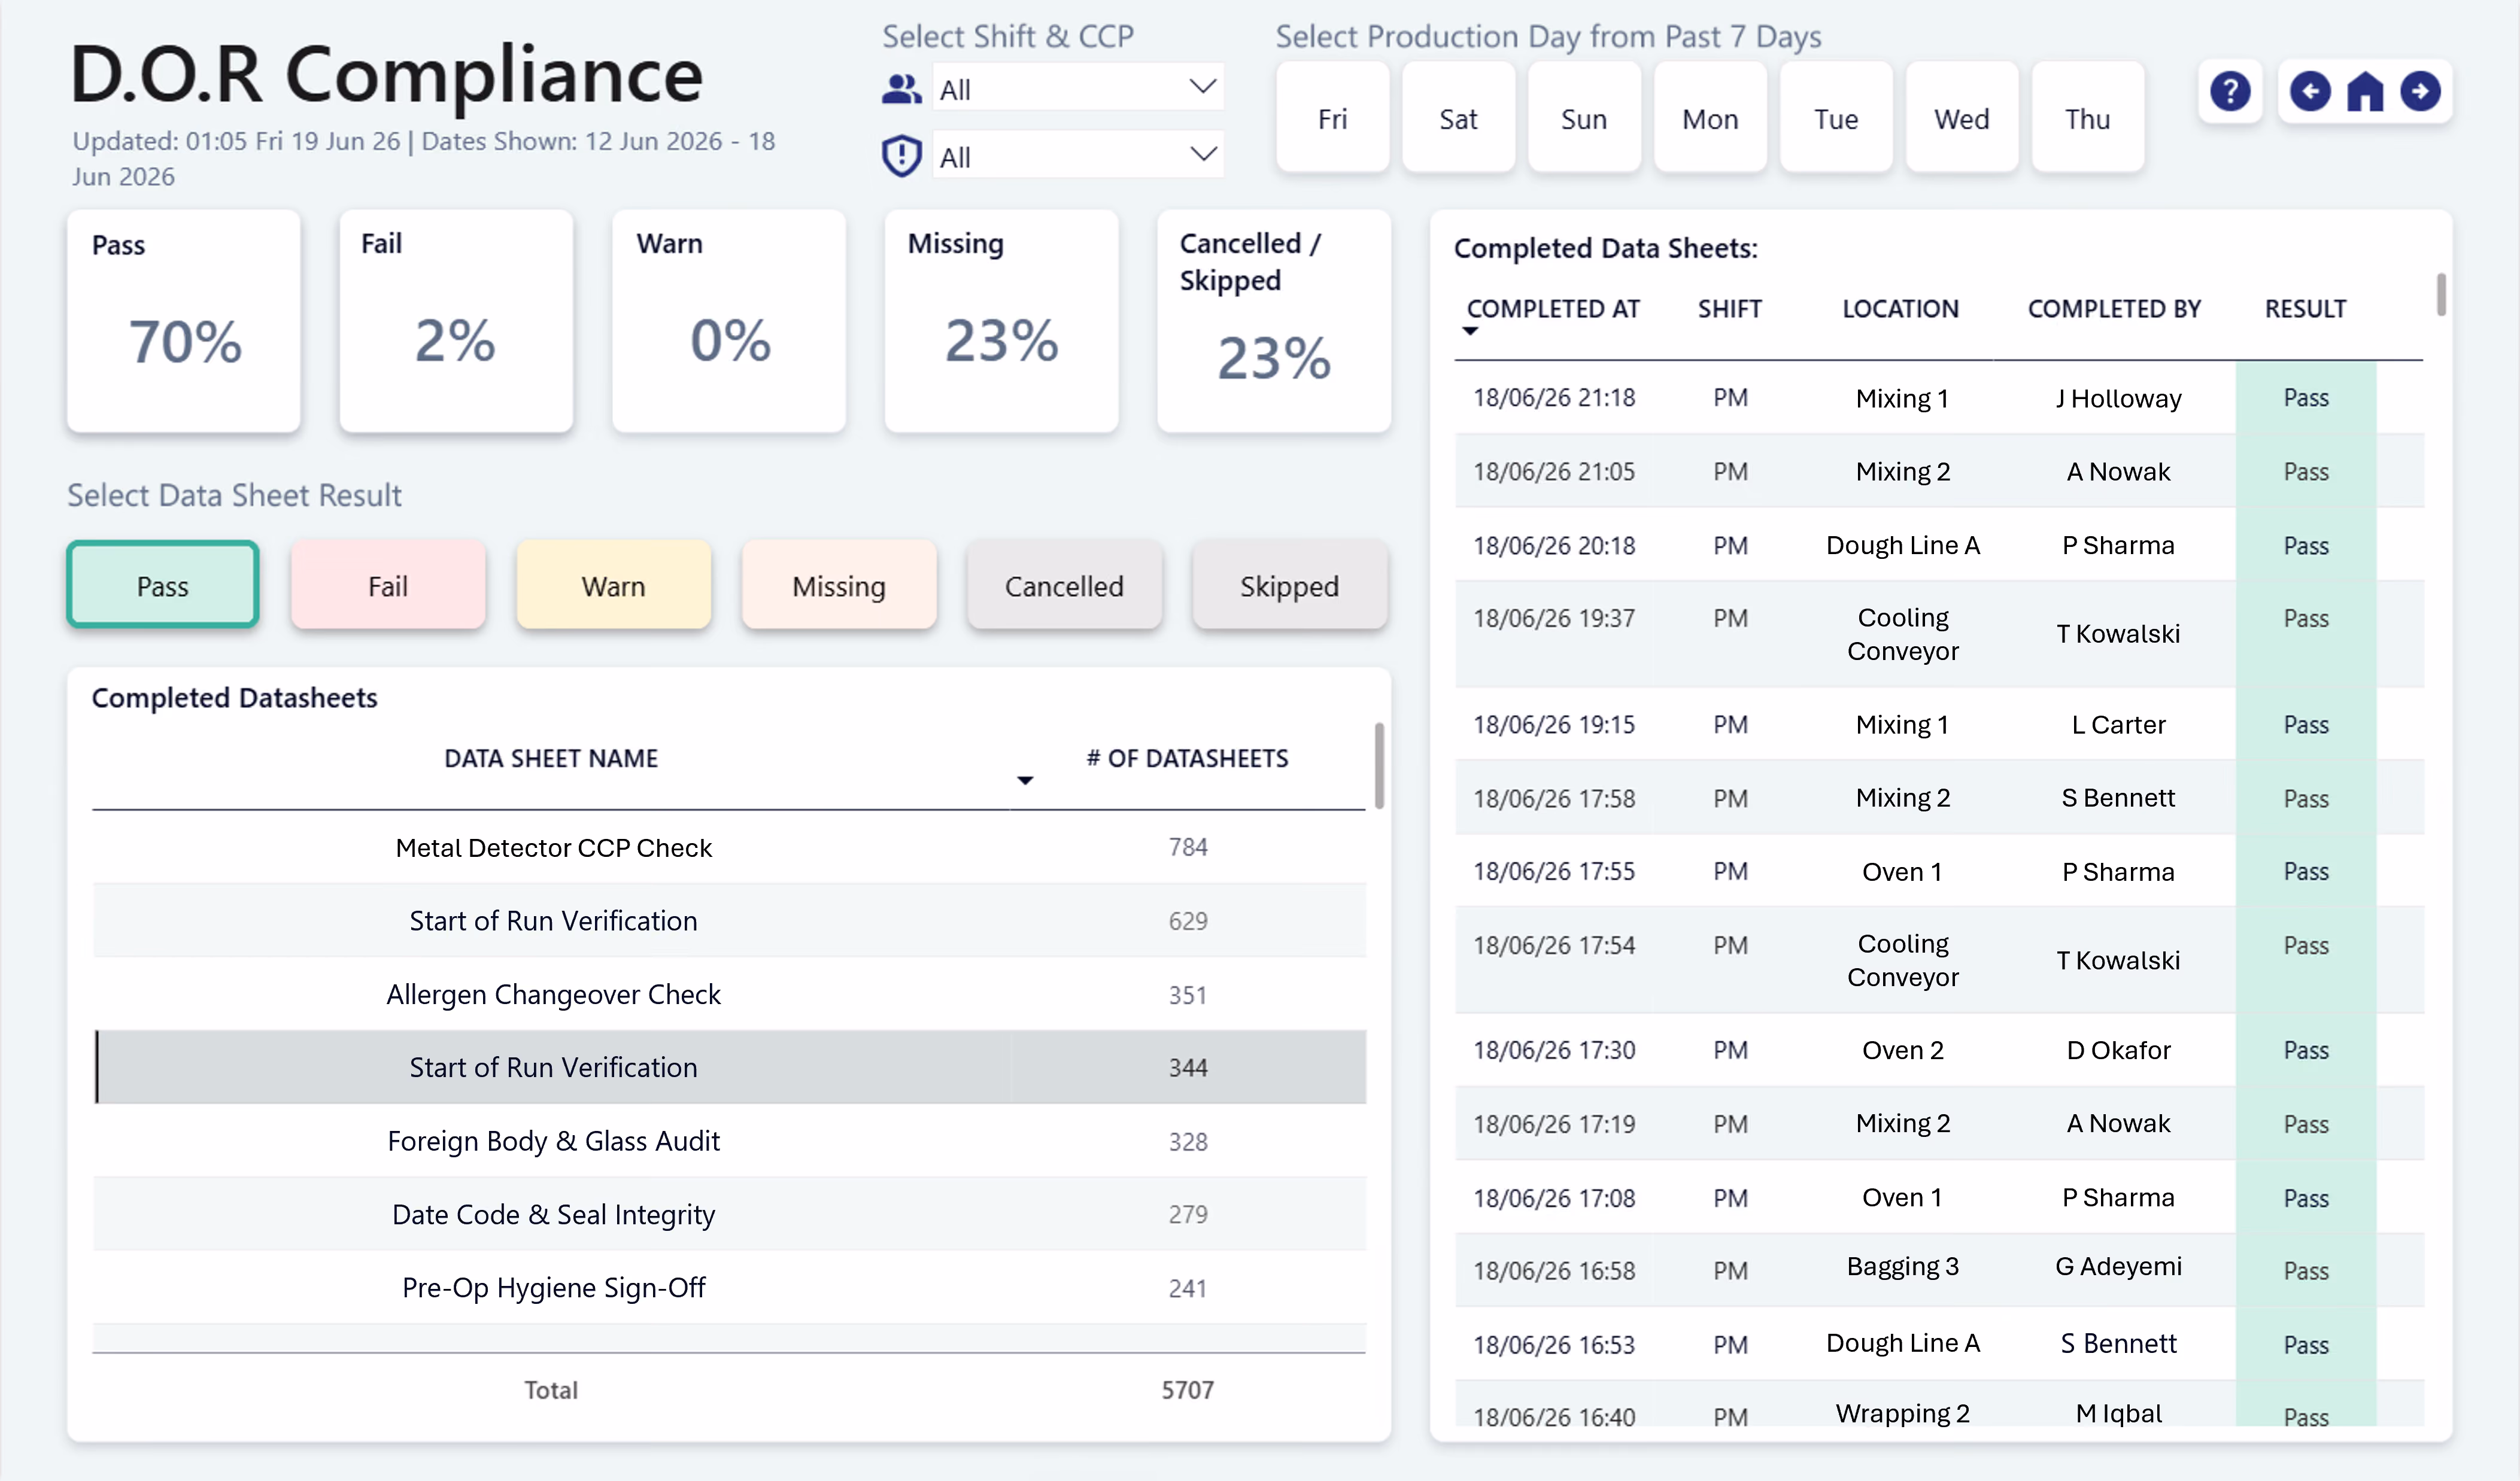
manta brings together all major loss categories, including availability, speed losses, and small stops, into a single comparable framework. This makes it easier to see what is driving performance and where to focus improvement effort.
At every level of the organisation, from site leadership to central operations teams, manta ensures the right questions are answered consistently. This supports better data-informed decisions that improve operational performance and deliver measurable bottom-line impact.
manta provides a consistent, structured view of operational performance over time. By bringing key measures together in one place, teams can quickly understand where performance is changing, what is driving results, and whether improvement actions are having the intended impact.
manta expresses all losses in comparable terms, making it easier to see which issues matter most. By viewing losses side by side across lines, products, or sites, teams can prioritise improvement efforts with confidence and focus on the opportunities that will deliver the greatest performance gains.
manta is deployed quickly on top of your existing Redzone data, so teams can start using it in days rather than weeks. We manage the platform on your behalf, keeping reporting reliable, relevant, and aligned as your operation evolves.
manta is designed to enhance the value of your existing Redzone deployment, not compete with it. Get in touch with our team to arrange a demo.
Get in touchmanta delivers operational reporting designed for use across all levels of the organisation, from operatives on the shop floor through to senior leadership. It provides consistent, trusted insight that supports both daily decisions and longer-term performance management.
manta defines a consistent set of objective performance measures and expresses losses in comparable terms.
This makes it clear what good looks like, where performance is being lost, and which issues should be prioritised for improvement.
manta provides views of performance over time, allowing teams to see trends clearly and distinguish normal variation from meaningful change.
This makes it easier to understand how performance is evolving, assess improvement impact, and identify whether gains are being sustained.
manta's report pages are tailored specifically for your daily, weekly, and monthly performance meetings.
With optional email subscriptions, insights reach the right people ahead of meetings, reducing preparation time and keeping conversations focused on action.
Alongside standard views, manta allows teams to explore data in more detail through focused deep dive pages, filtering, and build-your-own charts.
This makes it easy to investigate specific issues and answer targeted operational questions.
.avif)
manta is built as a modular product, so teams can choose the reporting modules that best support their operational priorities and Redzone implementation. manta always includes our core Performance module, with additional modules added as required.
We regularly release improvements and new features to keep manta evolving, and we always welcome suggestions from our users to make sure it keeps adding value.
The Performance & Planning module supports key operational reviews by providing a clear, objective view of operational performance across lines, shifts, and sites. It brings together availability, performance, and quality in a single, consistent framework, helping teams understand not just how they are performing, but why.
It also shows how actual production compares to plan, bringing together planned volumes and run times with actual execution to give a clear view of plan attainment. By highlighting where production has over- or under-delivered, and how much planned run time was actually achieved, it helps teams understand why plans are missed and where constraints or assumptions need to be revisited.
The module also provides visibility of how Forums and Actions are being used, helping teams understand how effectively Redzone is supporting performance management.
Key Questions Answered
The Safety & Quality module brings quality and safety reporting into a single view, so teams can see how both are tracking and whether problems are being dealt with. It surfaces emerging risks early and shows whether corrective actions are being completed and having the intended effect.
Quality reporting covers giveaway, compliance, and quality check results, showing where standards are slipping and whether checks are being completed on time and to standard.
Safety reporting covers incidents, near misses, and hazards, tracking accident rates, near-miss reporting, and hazard close-out, so teams can see where risk is building and whether it is being acted on.
This module builds on the Performance & Planning module and is available as an optional addition to manta.
Key Questions Answered
We also offer additional custom modules tailored to specific operational or commercial needs that extend manta beyond the standard modules.
Custom modules can connect to your organisational data and systems and, where relevant, be combined with Redzone data to answer specific questions. This allows teams to explore areas of performance unique to their operation, while keeping reporting aligned with the core manta framework.
Wherever you are in your Redzone journey, manta is designed to add value from day one and continue supporting performance as your implementation matures.
We help teams starting out with Redzone establish clear, reliable reporting from the outset. Drawing on extensive experience with connected workforce implementations, we support correct setup, avoid common pitfalls, and provide reporting that enhances Redzone’s core capabilities from day one.
We help customers with mature deployments take their impact to the next level. manta cuts through the noise, providing targeted insights that further increase operational performance and maximise team engagement.

Get in touch with our team to see manta for yourself and have an initial conversation about your reporting needs.
Get in touch
Considering building Power BI or Tableau dashboards on your Redzone data? Redzone gives you the ability to extract data through the Redzone Snowflake schema, but before you commit to building Redzone reporting in-house, it's worth weighing the benefits of a fully managed service like manta. We can deploy manta in a few hours, then work with your team to configure it fully and train your teams over the following weeks.
Crucially, data visualisation and reporting is only ever as good as the underlying data. That's why every manta deployment includes hands-on work to get your Redzone implementation configured optimally, drawing on our experience supporting manufacturers with Redzone across multiple sites and sectors. We've also developed a 12-point Redzone Implementation Scorecard that shows you exactly how well your current Redzone configuration is set up to drive accurate reporting and analytics.
If you're deciding whether to build your own Redzone Power BI or Tableau dashboards or buy a ready-made analytics product, a few things are worth keeping in mind:
Don't just take our word for it. Here's what people running manufacturing operations say about manta:


If you are using Redzone and want clearer, more consistent insight into operational performance, we’d love to show you how manta could benefit your team.
Contact us to book an introductory call with our team.
